

Anatomy Of The Big Steal
Anatomy Of The Big Steal
The Seven Year Itch (And Counting)

There are said to be just the two certainties in life – death and taxes. However, in November 2020, we could usefully have added two more; that there would be industrial level fraud in the US election and that Donald Trump would fail to secure a second term, because that's what America's political elites wanted and what they want, they get. Most outcomes can be guaranteed if all the people that matter are on the same page, because that means that there's no downside. Any residual opposition can then be neutralized and made an example of at leisure. And so it came to pass. But fraud on an epic scale leaves a trail.
Everywhere one looks, there are blatant anomalies. For starters, presidents fighting a re-election campaign who manage to increase their vote very rarely lose. Indeed, most presidents see their votes decrease and still win (Obama was down 3.5 million in 2012). Trump, on the other hand, gained 11 million votes and lost.
“Incumbent vote gain is another key indicator of presidential race outcomes. Since 1892, and as the expansion of the United States slowed, only six presidents have lost re-election. All six had fewer total votes in their re-election campaigns than in their initial campaigns. All incumbents who gained votes won re-election.”(1)
Candidates who win Florida, Ohio and Iowa win the election. This was an unbroken trend for sixty years. Trump won them all, Ohio and Iowa by eight points, and yet lost. There were also 27 'toss-up' House elections, where it was felt that either side could win. Trump's party won them all and gained 13 seats in the House of Representatives. On the day, they held all their Senate seats, too. And yet Trump still lost. Biden under-performed Hillary's 2016 numbers in every urban county yet outperformed her in every metropolitan area in the swing states of Pennsylvania, Michigan, Wisconsin and Georgia.(2) That's not subtle – it's targeted fraud.
Voting ranges are a very good guide to fraud. Over time, a body of evidence is collated and we are able to discern the range in which each parties votes stack up, county by county.
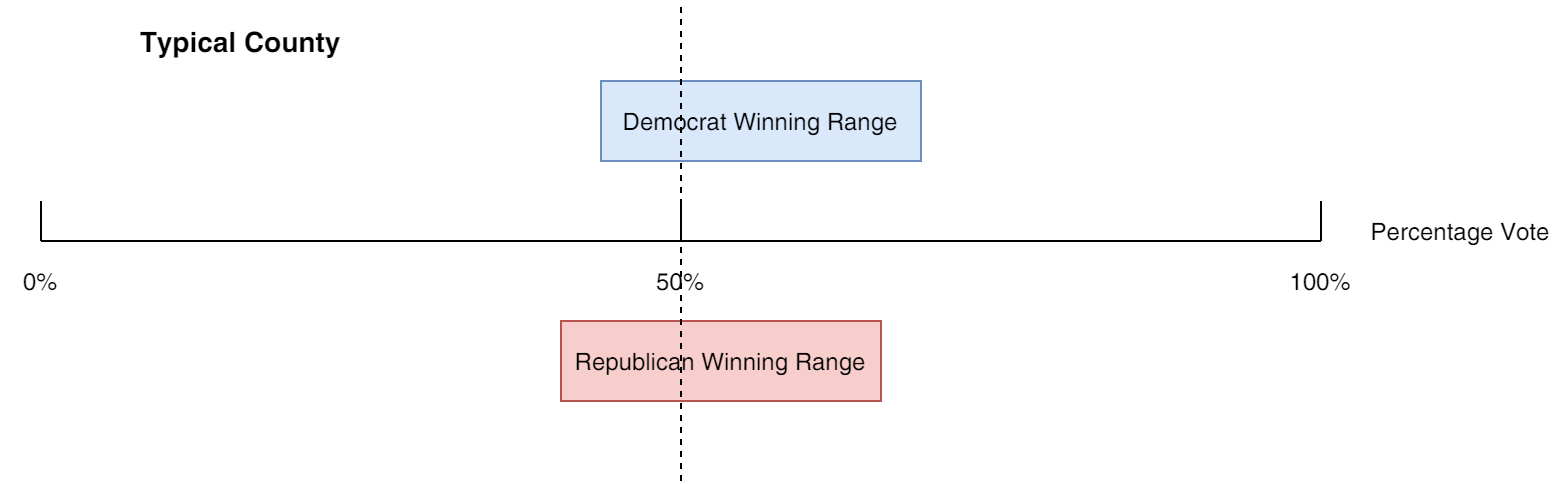
Figure 1
If one analyses the data from the biggest counties in the country, the pattern is clear. In the ones which Trump won, his votes total was almost always at the low end of the typical range that a Republican candidate would be expected to achieve. Biden's vote totals, by contrast, were stellar. There are 182 counties with over 200,000 voters in them and he won 146 of them. Out of the top 100, he won 90 and of those with over 500,000 votes (of which there are 44), he won all but one and even that loss looks like it was unintended.
While Trump won the remaining 36, none of them was by a margin that exceeded the upper limit of the long term Republican range; in fact, eight of the victories were gained with vote totals than were lower than the entire range and only eight were higher than mid-range – three of these were in Florida and two were in Pennsylvania. If we are to believe that these results are kosher, then we must accept that Trump won these counties despite a less than enthusiastic Republican base.
We would also be required to believe that Biden was extremely popular with his core voters, which seems somewhat counter-intuitive given the fact that he campaigned from his basement and could barely raise a quorum on the rare occasions that he ventured out. Nonetheless, in 83 counties, his total votes were at or above the upper limit of the Democrat range, sometimes by vast percentages, which means that he also outstripped Obama in many of them.
“What this means is that no Republican counties with over 200K votes increased their percentage lead from 2016 to 2020. It does not mean the total Republican votes did not increase. All of them did! It just means the total Democrat votes, in each of the large counties, increased more than the Republican votes (even within Republican strongholds!).
What makes this all the more confounding is that this trend only applies to populated counties. In smaller Democrat stronghold counties, with stable population growth, we observe large swings towards the Republican party.”(3)
Perhaps half of the large Floridian counties that voted Democrat are a more believable reflection of voter sentiment – the Biden numbers were under mid range in those elections – but, otherwise, the enthusiasm for his candidacy was remarkable. Of the remaining 63 big counties, his votes total was above the mid range in 38. In only three counties was he below the lower range limit, and two of them were only by 1.3% and 0.6%.(4)
And the stats keep on coming. It's generally accepted that Obama's election victory in 2008 was more of a coronation than a true contest, as he wiped the floor with John McCain, winning the popular vote by nearly 10 million ballots. In those lost days of innocence, there was no widespread scepticism about presidential election results; sure, JFK's triumph in 1960 was suspect and the 'hanging chads' debacle in 2000 wasn't a good look either, but “industrial scale election fraud” wasn't a phrase that was on anyone's lips. Obama was believed to have ridden the wave and won, fair and square. But Biden was no Obama – his primary virtue, to those invertebrates who just wanted some peace and quiet, was that he wasn't Trump rather than anything that he actually was.
And yet, if we are to believe the data, he was exponentially more popular, which is peculiar for another reason too, as the Democrat vote in a good number of counties has cratered in recent years. But somehow, Biden managed to not only stop the hemorrhaging, but also to vastly increase the blue vote. On the expanded list of the larger counties (over 100,000 votes), there are 27 where Biden has added 50% or more to Hillary's vote – four of the top eight are in Utah, for some reason. And, when all counties are collated, there are 530 where the rise in the Democrat vote since 2016 is 50% or more. Obama only managed a similar outcome in 52 of them and, if we take out Utah, Montana and Indiana, the number drops to 17 across all the remaining states. In fact, Obama lost votes in 77 of them, whereas Sleepy Joe picked up voters like no tomorrow.(5)
There is another unusual feature to these data; only six of the above-mentioned 27 counties were actually won by Biden, so this part of the operation is predominantly focused on adding ballots surreptitiously. It's logical to assume that there is likely to be less Republican scrutiny of a county which they won, even though there can be wider implications (and will be); otherwise why would the Democrats be doing it? Losing a large county by less might still mean victory in a state if other county totals make up the difference. Indeed, losing any county by less might do the job, depending on the size of the deficit that needs to be erased and, even on the larger list of all counties with a 50%+ 2020 increase, only 17 were won by the Democrats. There are many examples of counties that, even though they show a downward Democrat voting trend in 2012 and then again in 2016, apparently turned out for the Great Unifier in vast numbers, thus bucking the trend. None of the above makes any sense.(6)
Statistically, the vast array of anomalies are far beyond what is possible organically. There are 3,141 counties (or equivalents) in the US. Of these, Biden only won 567.
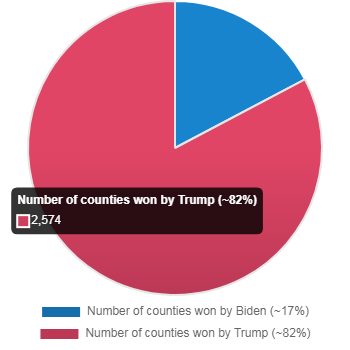
Figure 2
This looks like an unimpressive performance at first blush, especially when compared to previous winning Democratic candidates.

Figure 3
We've already seen the unprecedented swell of apparent support that Biden received in Republican-won counties. That enthusiasm is also reflected in the vote tallies in the few counties that he did actually win, once again eclipsing all who came before, despite the fact that of the 873 counties that Obama had won in 2008, 367 jumped ship and voted for Trump in 2020.
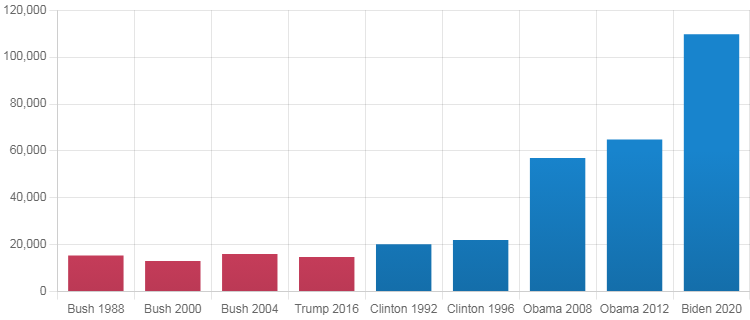
Figure 4
“The data shows the Democrats are winning less and less counties at each election, but are winning more and more of the largest counties. How is this possible?”(7)
Strictly speaking, it is possible because those are the totals that are posted and all concerned moved along as if there was nothing to see, Republicans included. But, as can be seen above, something peculiar is in the water – these trends do not look natural. The Republicans don't seem able to tally more than about 16,000 votes per winning county, but the Democrat numbers have ballooned from about 20,000 to well over 100,000. Why would this be?
“If we were told that Republicans lost cities like Chicago, Cleveland, and New York by margins of four to one, or even five to one, we began to believe that such wipeouts might indeed be possible. It probably never was. We so love and trust our system, we just accept the idea that nine out of ten city dwellers might indeed all be Democrats, when we’re a 50-50 country, or at worst a 60-40 country, everywhere else.”(8)
An examination of z-score data highlights the improbabilities involved. A z-score is a value that can be used to compare deviation from the norm. A score of 0 would indicate that the assessed value is equal to the mean in a dataset and a score of two would mean that the assessed value is two standard deviations away from the mean; which would be unusual, but not entirely unheard of, given that a z-score of 2.5 is on the 99th percentile – one in a hundred values would be expected to be that far out there. It follows that even higher scores are rarer still; when a data set is being parsed, a score greater than 3 would see that value excluded as an outlier.
The z-score analysis puts a value on the likelihood of these outcomes. If a score of 2.5 or more is a one in a hundred shot and there are just over 3,000 counties of which Biden won 567, one might expect to find perhaps five or six such examples in Democrat won counties and maybe thirty overall. In fact, those numbers are 73 and 388 respectively, the latter spread across 37 states.(9) There are 79 counties (out of Biden's 567) with scores over 4 (super extremely rare), with Texas, Georgia and Tennessee to the fore. Better yet, a county in Alabama has the other-wordly z-score of 19.82 and Kansas has three counties with a score of 8+.
A similar analysis of Democrat Party registrations and subsequent vote totals reveals another 331 counties with a z-score on the 99th percentile or above and, interestingly, there is little cross over between the two groups; in total, there are 647 counties with hugely unlikely Democrat voting patterns, many of them large; a one-in-five outcome, or twenty times the rate that it should be. In 2016, there were 18 counties which could be considered statistical outliers. In 2020, that number was 719.
“Just think of the odds that the same person would be struck by lightening 3 years in a row, at exactly the same location, on the same date, at exactly the same time, wearing exactly the same clothes, with Mars, Venus and Neptune being aligned, during a total solar eclipse, without a single cloud in the sky.”(10)
There are also eighteen states where the Republican registration data does not compute in 2020 and, interestingly, all of them looked legit in 2016. That is to say that in Trump's first go around, rising Republican registrations translated into more votes, as would be expected. However, in 2020 (in all eighteen states), the trend inverted and more registrations resulted in less votes. Eight of them are particularly egregious and, at county level, of the 101 examples, 57 were won by Democrats. As previously noted, more registrations and less votes is not a trend that one would expect to see replicated so widely.(11)
Before we dispose of the z-score mode of analysis, it's worth a quick look at overall turnout. We know Trump's official vote total was up 18% on 2016, although Biden's was somehow over 23% in excess of Hillary's. The net result was that, during a 'pandemic', there were allegedly more total ballots cast than ever before.

Figure 5
Numerous states smashed their previous records. In 21 of the 50 states, the increase was at the 95th percentile or above, or “rare” - a one in twenty possibility. However, 14 of these states managed a z-score of 2.5 or above. The numbers for 2016 reveal not a single state at the 95th percentile. Just another massive, unexplained anomaly amongst many.(12)
What we need are control samples, because if the entirety of the data is suspect, we have no reliable baseline; we are all at sea without some idea of what the election should have looked like without fraud. Fortunately, there are two such datasets to hand; an almost 'clean' state and the trusted counties, or bellwethers. Arkansas, which is (ironically) where Crooked Hillary hails from, is the state in question and it is reliably Republican. With the exception of the three largest (naturally), the 75 counties voted remarkably consistently. The seven that still voted for the Democrat in 2020 did so unenthusiastically, in numbers that were either low in the established range or (for two of them) not even in the range.
In the counties Biden won, the gap between blue and red tightened in percentage terms by an average of 5.5%. Of the 65 remaining counties that voted for Trump, a mere four did not exceed the historic range and the average victory margin increased by 6%. These numbers also line up with the fact that, despite whatever mitigation the Democrats managed, Trump was up nearly 11 million votes overall on the official count. This is, of course, in stark contrast to the dynamic that played out in the largest counties in the land where, as noted above, the voting trended in the opposite direction.(13)
Our other sample is the performance of the bellwether counties. They are a rare breed. They are sufficiently eclectic to sway in the political breeze, reflecting the general mood of the country inasmuch as they always vote for the winner, whether that be a Republican or a Democrat. As such, they are almost certain to have largely escaped the contamination that has been injected into so many other jurisdictions – inflated vote totals and unheard of ratios are things that have passed them by.
There are 22 of them that had an unblemished record in every single election between 1988 and 2016. If we go back to 1980, there are still 19 bellwether counties, over ten election cycles, prior to 2020. Given that there are, as we know, over 3,000 counties, this makes them a rare and valuable yardstick. From the perspective of pure random statistics, there should only be perhaps a dozen, which indicates the outsized predictive capacity that is at work here. Their existence
“... far surpasses any “statistical” explanation, because at the end of the day we are dealing with real people, with real personalities, concerns and aspirations, which happen to align perfectly with the whole American population.
Their concerns are real. Their hopes are real. The matters that way on their minds are real. Their emotions and decision making process are real. They are not a “statistical” curiosity, but the perfect distillation or embodiment of the whole country’s sentiment.”(14)
At least, they were until 2020. Now the 19 (and the 22) has been reduced to 1, as 18 (twenty one) of them voted for Trump. The only county left standing is Clallam in Washington state and even that race was tight – Biden was only 3% up.(15) If we delve into the detail, the entire affair becomes even less explicable, because Trump' victories weren't even close. There were large margins, as he won them by an average of 16%. On a larger list of 58 bellwethers (which are very nearly as consistent as the 19), Trump won 51 by an average of 15% and Biden won 7 by an average of 4%.
If we expand our investigation to counties that have been a reliable guide in the more recent past, we can examine swing counties. These are counties that, while not quite possessing the pedigree of the bellwethers have, since 2004, swung between the Republicans and the Democrats, always voting for the winning candidate in the four elections cycles to 2016. There are eighty of them, 27 of which are also in the swing states and should therefore be the most likely to defect to the Democrats again if the national sentiment genuinely favored Biden. However, all but two of them voted for Trump.
If we push the envelope even more, in an attempt to move the needle further in the Democrat direction, we can look at counties that were all in on Obama in 2008 (with at least 60% of the vote going to the Democrat) and yet begrudgingly voted for Trump in 2016 - and I do mean begrudgingly as his average percentage of the vote of the top nine such counties was 51.3%. Of these nine, Trump won eight in 2020 and increased his average vote to 55.3%. In short, it doesn't much matter which methodology is applied to the “trusted” counties; Trump still crushes it.(16)
As an aside, a close look at z-scores indicates that the Democrats did put their thumb on the scale in 2016, after all – but with insufficient pressure. Of our 182 counties with a vote total of 200,000 plus, Hillary won 131 (including 40 of the 44 with over 500,000 votes and 83 of the top 100) and that's as it should be, isn't it, because we have been told repeatedly that the Democrats overwhelmingly live in the cities and the Deplorables are rednecks that live in the rural. Except that many of them clearly didn't in the year 2000, for example, when 85 of these counties voted Republican, including 15 of the top 44, But, no matter – by 2016 (even on the occasion of another Republican victory), that number had shrunk to 51.
In seven of these large counties, Trump's tally exceeded the upper limit of the historic voting range and in eleven, he suffered a blowout with a total below the lower range limit, which doesn't make a whole lot of sense. Hillary, the losing candidate, was not afflicted by anything remotely similar. In over half of her victories (69, to be precise) she blew past the upper limit of her range, sometimes by hundreds of per cent. Twenty eight of these were from the counties with 500,000 plus total votes. In another 32, her total was in excess of mid range, with nine of those over 90%. There were only six counties where her total was anemic enough to fail to reach the lower threshold.(17)
For those of a romantic persuasion, who'd like to believe that, no matter how long a shadow hangs over the last presidential election, at least the 2008 election was unsullied and that America in some way redeemed its racist past (although slavery, the KKK and Jim Crow laws were overwhelmingly Democrat obsessions) by electing a biracial (not black) president, I have some unwelcome news. As per Trump's Arkansas example, one would expect to see a very strong Obama performance in 2008, with numerous counties producing new record margins outside the established ranges and, in the largest counties, that is largely what we see; what's more, most of the numbers are conceivable.
There are, however, at least 13 with preposterous vote totals, with swings of up to 26%. Ten of them were flipped to the Democrats and the other three are seats that were only marginally blue, but which were made safe and, in an election where the largest, truly safe blue counties (where there was no particular need to fiddle the result) added an average of 8% to their winning margin, there were another sixteen that flipped to Obama with a swing of 16% or more.(18) In retrospect then, a now familiar pattern emerges.
In short, this isn't the Democrats' first rodeo. Highly suspicious voting patterns – which overwhelmingly favor the Democrat candidate - are a feature of presidential elections, going back at least four cycles, but it appears as if whatever methodology was being utilized was no longer enough in 2020. It may be that the 2016 effort wasn't primarily a failure of foresight, but rather a problem of scale; the erroneous belief that Trump could be defeated handily because Hillary's existing support plus traditional “ballot harvesting” would be enough to get the job done. There was, therefore, a requirement that election controls needed to be considerably loosened if they were to overcome Trump at the second attempt.
We know the outcome of that effort. But how did it happen? And what were the operating mechanisms? Let's start with what can't explain it and that is the appeal of the candidates themselves. Despite Trump's missteps with regard to the 'pandemic' and the best efforts of the Democrats to investigate and impeach him, he still commanded enormous support. Prior to the lock-down in March 2020, he had held 33 large rallies across the country (with another 40 held post nomination). Despite the fact that, as the incumbent, he was effectively unchallenged, people still turned out in vast numbers to vote for him in the primaries and, as a result, he polled 94% of the vote. For context, no candidate who polled more than 75% in the party primaries has ever lost a presidential election, Republican or Democrat.
And Biden? He wasn't even in the frame to begin with. The sole focus of the DNC (Democratic National Committee), as it had been in 2016, was to “Stop Bernie” by fair means or foul. In the primaries, the centrist Clinton faction and the Leftist Sanders faction were in a battle for control. Sanders was the early leader and was vying with Pete Buttigieg (a centrist, allegedly) in Iowa and New Hampshire, although there were still eleven candidates in the race at that juncture. Importantly, not one of them was to the left of Sanders, so it was unlikely that he would be the recipient of any other candidates' votes should the field thin out.
Biden came fifth in New Hampshire, with only 8.4% of the vote. Three centrist candidates then abandoned the race and endorsed Biden, but he was still only second come the next primary, with only half the votes of Sanders.Matters had improved somewhat next time out, where Biden won convincingly (and suspiciously) over Sanders. Buttigieg and two others then quit the race and, after Super Tuesday, Biden was in the driving seat, winning ten of the fourteen states.
Candidates were dropping like flies and, within a fortnight, only Sanders and Biden were left. Bernie then quit three weeks later, purportedly at the behest of Obama and Biden was declared the heir apparent, by default.(19) But it was clear from his concession speech that Bernie's ideas were going to live on in the allegedly centrist Biden.
In truth, neither man was a huge hit with the Democrat base, particularly when compared to Trump's effect on the Republican voter:
“Look at the results in Colorado tonight so far Bernie Sanders—238,345 Mike Bloomberg—146,907 Joe Biden—147,562 Total for the three front runners: 532,814 Donald Trump—569,441 No one HAD to turn out for the incumbent But he still outdid the top 3 Democrats Incredible.”(20)

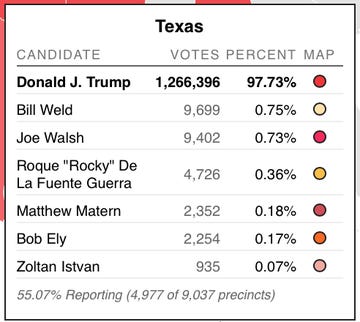
Figure 6
It wasn't simply the fact that the Democrat candidates evinced strictly limited enthusiasm amongst their target audience. It was also the reality that Trump was exponentially more popular than any previous incumbent going for a second term.
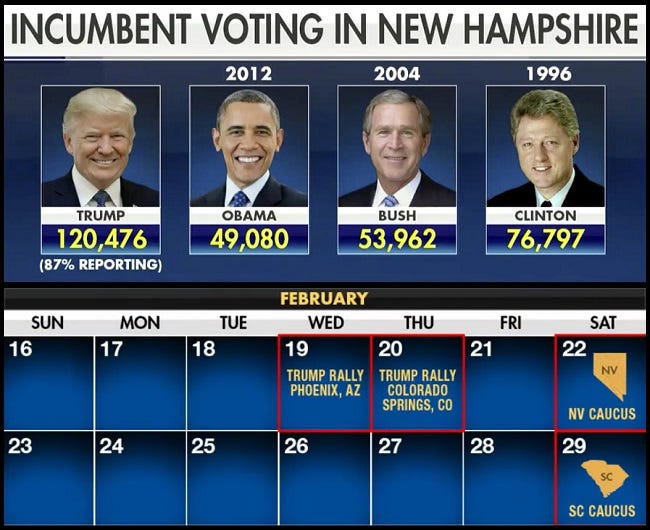
Figure 7
And, of course, once the respective nominations had been secured, Biden spent the entire campaign giving scripted answers to softball questions in his basement, while Trump's rallies continued to attract huge crowds. Additionally, the long war of attrition in the Democrat primaries (transparently another DNC inspired plot against Sanders) left progressives embittered and unenthused. Based on what the available evidence tells us about the candidates' popularity, the subsequent election numbers don't pass the smell test.
But on election night itself, initial results did made sense. Trump immediately carried three states that the media and pollsters had labelled battleground states; Texas, Florida and Ohio, the latter by 8% (when polling indicated a win by 1% or less) and Florida by 3.4%, an increase of 2% on 2016. The Florida and Ohio results, in particular, were seismic. The pre-election polls were out by 6% and 7% respectively, favoring Biden over Trump.(21)(22) A slew of election night results confirmed the trend, to a greater or lesser degree. Idaho was out by 7%, Missouri by 7.6%, South Carolina by 4.7%, Kentucky by 10% and New Hampshire by 4% - this notwithstanding the almost nationwide inflation of the Democrat votes in staunchly Republican counties.(23) Without that phenomenon, the swing to Trump would have been considerably larger.
Should this trend be confirmed in the so-called swing states, Trump was going to score a landslide win. And, while none of them had completed counting by late on election night, if anything some of the swing states were posting numbers well in excess of others; against polling numbers, Trump was up 18.4% in Pennsylvania, 15.3% in Michigan, 7.5% in Georgia and 12.9% in Wisconsin, all states he had won in 2016. And then the swing states (six of them, including Nevada and North Carolina) stopped counting votes.

Figure 8
At least, that's what they said they were doing. It had never been done before – accepted practice was that the counting continued until it was done. But, across the six states, poll watchers were sent home and operations allegedly shut down until the morning. Then, overnight, this happened:
“A vote update in Georgia at 1:34 AM on November 4 added 136,155 votes for Biden and 29,115 votes for Trump.
A vote update in Wisconsin at 3:42 AM on November 4 added 143,379 votes for Biden and 25,163 votes for Trump.
A vote update in Michigan at 3:50 AM on November 4 added 54,497 votes for Biden and 4,718 votes for Trump. Another vote update in Michigan at 6:31 AM on November 4 added 141,258 votes for Biden and 5,968 votes for Trump.
In one particular vote spike in Pennsylvania during the wee morning hours of November 4, approximately 570,000 votes were added to Biden’s total, while a mere 3,200 were added to Trump’s total – a ratio of about 178-to-1.”(24)
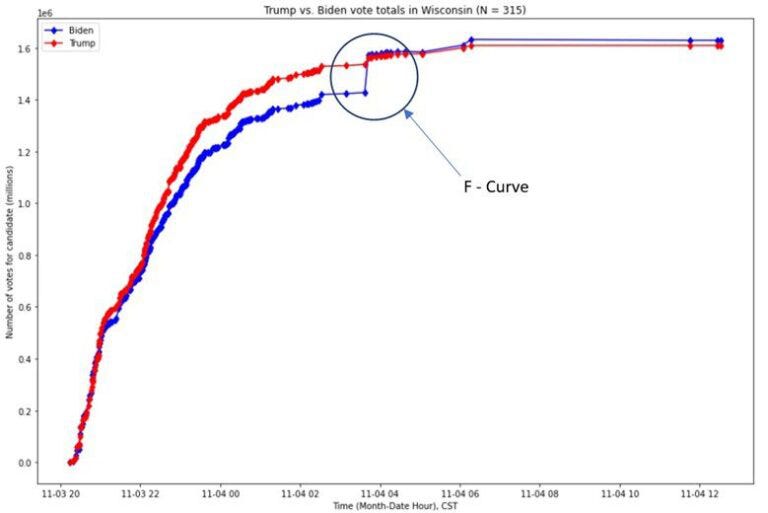
Figure 9
The infamous F-curve started featuring, in county after county in at least twenty states, all of them favoring Biden.(25)

Figure 10
And updates like this were reported by the networks.
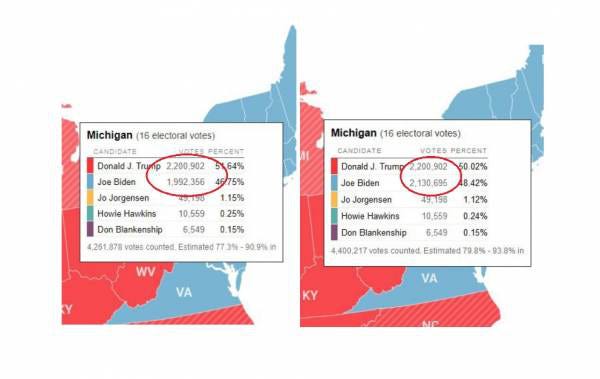
Figure 11
These states (together with Arizona and Nevada) continued to “count votes” for days after the election. North Carolina and Georgia didn't declare the task complete until 14th November, eleven days late. In six of these seven states (excepting North Carolina), Biden received a hugely implausible leg-up in the middle of the night, while no counting was supposed to be occurring and, once his nose was in front, it stayed there. A natural curve on the chart was replaced with a more-or-less flat line once the night time ballot drop had been introduced. But, before getting into the granular detail of where these ballots come from, it's worth addressing one other factor; namely, whether the vote totals on the screen bear any resemblance to the ballot counting process, anyway?
The answer is, perhaps surprisingly, no. ENR (Election Night Reporting) is, regrettably, merely a tool to shape perceptions, rather than a report reflecting a genuine ballot count. It's not real; the media just pretends that it is, so that they can “call” elections, when given their instructions. Secretaries of State publish data, but there is also central control:
“... the real powerhouse in election night reporting comes from a foreign owned, Spain-based company, called Scytl. Scytl collects all state ENR data and provides it to Edison Research. Edison works in tandem with all the legacy news agencies that televise election results.”(26)
Behind the scenes, on election night, the Democrats were staring disaster in the face. Trump was surging in the swing states and the gaps were widening. They had two main, interconnected problems. They needed to find some favorable ballots fast and they needed to control public perception while they did that, because the wider the gap became, the more exaggerated the F curve would appear. I imagine that they had gamed this scenario prior to the election, as the multi-state overnight tactical lock-step would suggest and, as the relationship between ballot counts and the ENR is purely ephemeral, they were able to employ the nuclear option and control-alt-delete the entire system.
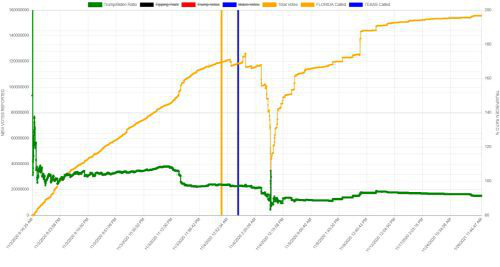
Figure 12
The yellow line is the cumulative total of the national vote and the green line is the Trump to Biden ratio. Just after Florida and Texas were called for Trump (the yellow and blue lines vertical lines), it's believed that all the votes in the ENR system were pulled and reset to zero. From this point forward, none of the data would represent the reality of the count.
“Several experts in election analysis circles believe that Florida and Texas were originally slated to go to Biden, but when Trump received more support than expected, “Plan B” was deployed. This required seven smaller states to: (1) stop counting, (2) recalculate the algorithms, (3) reboot the ENR system, and (4) retabulate the votes in different percentages to give the election to Biden.”(27)
It took two days to put all the votes back in the system. And yes, algorithms. On that point, there can be no doubt; the function is called a proportional-integral-derivative control function (PID control) and it's the type of algorithm that would control a thermostat or a cruise control system, whereby the system will get to the set point fairly swiftly and then, when the temperature (or speed) drops below the designated limit, it will gently restart and boost the process. The exact same relationship is found in the Trump-Biden ratio in every single state. The ratio rose until it exceeded a set point and then gradually subsided.
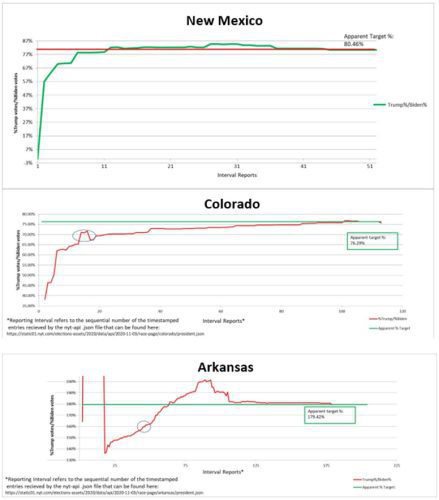
Figure 13
Even “clean” Arkansas was not spared. But the initial counts in these states stayed within anticipated bounds, so there was no need to redo the set point in the middle of the count. The swing states, however, behaved differently.
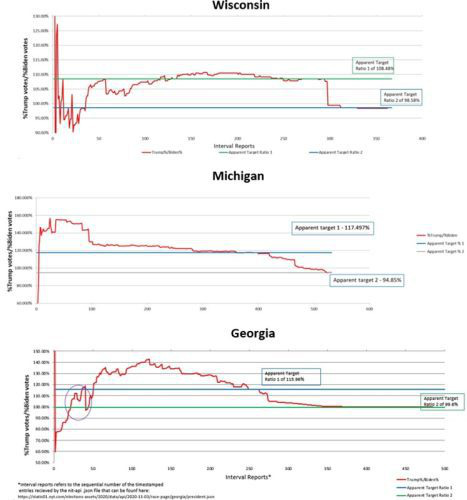
Figure 14
It appears as if they were originally slated to go to Trump, as the initial set points would have resulted in a Trump-Biden ratio that gave the former victory (crumbs from the Democratic table), but the wipe-outs in Florida and Texas - and the consequent loss of 67 Electoral College votes - necessitated a change of tack. Other states, those not considered eligible for battleground state status (largely due to biased polling), also had to be reset, Virginia amongst them. That's how well Trump was doing, in reality.
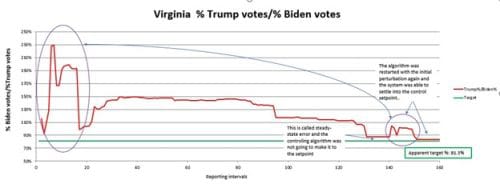
Figure 15
Further evidence is provided by the tallies of split votes, where the algorithm has allocated a percentage of a vote to either candidate which is, of course, not possible in the real world. This is a frequent feature of the ENR data. None of this manipulation would have to be done in situ, either. In Wisconsin, for example, the voting machines (which were said to be sans modems and therefore unable to be accessed via the internet) were connected to an unofficial IP address belonging to an NGO called WiscNEt.(28)
Further, an examination of the election management systems in Michigan, Georgia and Arizona found evidence of anonymous log-ins by remote users with elevated privileges – these privileges included the ability to alter election results.(29) And, despite vehement statements to the contrary, the Dominion voting machines used in many counties are riddled with vulnerabilities that could be exploited by anyone with the ability to access them remotely in exactly this fashion.(30)
The revelations around ENR and the Big Pause on election night may appear shockingly unlikely, but they are not in fact unprecedented. The Mexican election of 1988 and the Bolivian presidential election of 2019 share the same traits.(31) And similar data manipulation had also occurred inside the US, in 2018 and 2019, in Texas and Kentucky respectively, where voting company technicians simply overrode the system error codes (such as “votes exceed ballots”) to swing the elections towards the Democrats.(32)
Given the number of moving parts, any plan to steal the election would need to be meticulously modeled ahead of time and there are certain data that malefactors would need to be in possession of. Pre-election polling would give them a ballpark notion of voting intentions (although we've already seen that the margin for error is a problem, especially so in Trump's case as the media had spent the best part of four years characterizing his supporters as a “basket of deplorables” - expecting all of them to then reveal their voting intentions to a pollster was unrealistic), they'd need to monitor turnout and it would also be necessary to know how people were actually voting - especially during early voting. This information is not hard to come by. Turnout data is distributed by the states and the other information is gathered by Edison themselves; for every county in the country.
The curse of early voting (even though a good proportion of it is in-person) is inextricably linked to the absentee ballot, the prime instrument of choice for the election fraudster. Until the 1980s, the only options were to vote in person on the day or via absentee ballot, but only if a person could not do so because of illness or disability. But the combination of no-excuse absentee ballots and early voting is essential to the attempt to minimize on-the-day voting in person, which can result in an inability to produce the desired result. Once again, it should be remembered that these were not options that were ever required in past elections, but which are now part of the new normal methodology with regard to ballot casting. Some states now take it to the extreme – in 2016, North Carolina commenced early voting on 9th September, eight weeks prior to the election,(33) but the average early voting period is still as high as nineteen days.(34) This means that any such ballots will languish for days, if not weeks, at an election center. The problem with that?
“Fraud is a genuine risk. Making early ballots disappear from overwhelmingly Democratic or Republican precincts could throw elections .... Even among angels, storing ballots for weeks risks their innocent misplacement, damage, or destruction in fires, floods, hurricanes, or tornadoes.”(35)
More particularly, early voting allows those who seek to steal the election the luxury of time; it's important to note, however, that it might not always be an advantage to the fraudster if these votes are also counted early (as in Florida), because that raises the possibility of being boxed into a corner if the opposition vote proved to be a fair bit larger than anticipated. An informed estimate is the favored methodology, as all options need to be kept open, including 'disappearing' ballots. The fraudster can then calculate how many ballots they might need in the worst case scenario and take steps to have them filled out and deposited. The combination of the rash of last minute lawfare designed to extend deadlines and loosen integrity safeguards (such as voter ID and signature matching) and 'pandemic' trepidation, ensured that there was a huge increase in absentee ballots, with over 92 million supposedly requested.
Unsurprisingly, the number of people voting early proved to be unprecedented. In 2016, around 40% of the public voted this way, which equated to some 50 million ballots. In 2020, that total had doubled and, as a proportion of the total vote, now approached 65%.(36) In the swing states, by election day, millions of ballots had been requested but not returned (allegedly). So, how might the early voting have been weaponized?
“With the data collected in all fifty states by Edison, it is perfectly possible to make an estimate of how many ballots need to be inserted in specific jurisdictions during early voting to swing an election. Then using the real-time vote count as it comes in on election day, those estimates can be updated and revised in real-time. Since Scytl controls the flow of ENR data nationwide, they can slow it down when adjustments need to be made – for weeks if necessary.”(37)
In states where absentee ballots were counted before election day (Ohio and Florida, as we've seen, but also Louisiana, Alabama and Utah) Trump either held his own or, in the case of Utah, vastly outperformed his polling numbers. In other news, the top ten states for Biden – in terms of his outperforming Hillary in 2016 - all relaxed their voting regulations prior to the 2020 election, particularly around absentee ballot deadlines. Five of them were prevented by law from counting mail-in ballots prior to Election Day.(38)
Which is all well and good, as far as it goes. It seems that the combination of sleight of hand technology and early voting practices offers an opportunity for fraud. But ballots are still integral to the process, surely? How are they magicked into existence and deployed? For the most part, the answer to those questions lies with voter rolls because, in theory (but not in practice), nobody can vote unless they are already registered to vote and people are registered to vote whether they like it or not. They are being created precisely because such people are unlikely to vote.
Any interaction with the state bureaucracy will do; state benefits, state ID, state college, marriage, change of address – you name it, voter registration comes with it. Some of the people availing themselves of such services or obligations will not be citizens and should not, therefore, be eligible to vote. And a lot of these people won't vote, which is a boon to the fraudster, because these ballots are destined for the slush fund.
I digress. The key with the voter rolls is to stuff them full of names and then to refuse to remove any, for any reason. People who have died or moved are still on voter rolls in every state in the country, alongside people who have never even existed – the phantom voter. Wisconsin, a key swing state, is a particularly egregious offender. They have 7.1 million names in the database, but only 3.68 million are eligible to vote.(39) Over 550,000 of their registered voters have a registration date of 1/1/1918 and 115,252 of those voted in 2020.(40) That's how secure their election is.
This is also the state that added 29% of their entire voting population to the rolls in the ten months prior to that election – over 900,000, at least half of whom registered online.(41) Wisconsin wasn't alone, as every state (except Wyoming) added voters to the rolls between the 2016 and 2020 elections, whether their state populations grew or not. Georgia added 2.3 million, despite population growth of only 425,000. Illinois added over 1.3 million, even though the population shrank by 141,839.
In North Carolina, the ratio of registrants to increase in population was four to one and in many other states it was ten to one or more. Michigan added 2.7 million on a population increase of just 117,000.(42) Nationwide, a recorded population growth of just over 8 million, accompanied by over 56 million new voter registrations and more than 26 million extra votes. And, bear in mind, the new residents won't all be of voting age, either, so the number of new registrations is even less believable.
“A Secretary of State may be all in on voter fraud. In deep-blue states, we found leftist groups with real-time electronic access to voter rolls able to enter voters – real or fake.”(43)
Some of them will undoubtedly be genuine registrations, but it's difficult to imagine that this many voters had escaped the states' gimlet eye prior to 2020, especially those with implausible birth dates which show them to be centurions; in Alabama, there are over 3,000 such persons and three of them are over 1,000 years old. That's small fry – Michigan has more than 10,000 voters over 100 years old.(44) The phantoms will have addresses that don't exist, or which aren't residential or, if they are, could not possibly accommodate the number of people registered there. In Georgia, there are 2,600 people living in a church and another 600 living in a post box.(45)
“Billy X has 239 people living in his one-bedroom Pennsylvania house and they all voted. All public information. Billy should be proud of his diligence. We connect Billy via 100 social media posts floating on the internet using a web crawler. Look, Billy is a steward for the local trade union. He hates Trump.”(46)
Ballots that are undeliverable, due to a false or incomplete address, are returned to the USPS and dumped in a bin which will be regularly emptied by persons unknown. Other ballots, with genuine addresses but no resident voter, will languish in apartment building mail rooms and the like until collected by a paid Democrat Party operative.
Then there are genuine citizens, but a good proportion of these are people who don't habitually vote; well, they don't think they do, anyway. But these voters are as useful as the phantoms, because they are equally unlikely to scupper the scheme by turning up in person and, if by some chance they do, they'll simply be told that they've voted already, have a nice day.
This all might seem a little too conspiratorial. Surely, it can't be that bad, can it? At the state level, this scheme seems to require a considerable cast of characters, not least a collection of Secretaries of State (SoS) of differing hues. They're not all Democrats, after all. In fact, there are currently more Republicans in the position that there are Democrats, 26 to 22. But, in November 2020, six of the seven swing states (including Arizona and Nevada) had Democrat Secretaries of State, the sole exception being RINO Raffensberger in Georgia.
However, party affiliation doesn't seem to matter all that much, as establishment Republicans were as anxious to be rid of Trump as their notional opposition and you don't get to be an SoS for the red side of the aisle unless you're perceived to be made of the right stuff and receptive to the Uniparty agenda. As a consequence, all shades of SoS are dead set against cleaning up their voter rolls, even when confronted with 23,000 people who have the same 'phone number and have done for thirty years.(47) They just don't want to know.
“Anyone who thinks voter fraud is a Democrat party thing will be disappointed: voter roll fraud is a truly bipartisan enterprise. Democrats are better at inserting phantom voters – particularly in large urban areas. The Republicans hold their own in deliberately salting voter rolls so citizens cannot easily find what their Democrat pals inserted. The one constant is the Secretary of State’s office, whether Democrat or Republican, lies somewhere along the denial curve – from acquiescence to denial to outright instigation of sovereign voter fraud.”(48)
They are given top cover by their affiliation to ERIC (the Electronic Registration Information Center), a private company originally funded by that man Soros and the Rockefeller Family Fund, which ought to automatically ring alarm bells. It's supposed to be responsible for maintaining accurate voter rolls, but that's not what it does in practice. Nonetheless, thirty one states send it all manner of voter information, including data that can patently be used in the manipulation of elections:
“ERIC demands additional data, like the total number of provisional ballots cast...They want totals of provisional ballots counted, provisional’s uncounted, and why. They want to know who registered or updated their data, then voted that same day. They require data on those who registered using paper and those using electronic methods.”(49)
While there is no publicly available proof as to what exactly they do with this information (even SoS's don't know), what they don't do with it is clear. There is no requirement to clean up the rolls, but there is a rule that prohibits the transmission of any evidence that an individual is a non-citizen, which is a curious stipulation, as it will only serve to pollute the rolls further. ERIC also places a requirement on states to contact a targeted list of people within 90 days, to solicit voter registration,(50) which will also clearly expand voter rolls rather than cleanse them.
My bet is that the vast majority of them will be on the list because they aren't likely to vote and haven't done so for a while. It seems that this strategy is a success; some of the largest gains in voter registration came from states affiliated with ERIC. There are variations on the theme (such as hundreds of thousands of inactive voters who suddenly become active at the time at which ballots are allegedly posted, only to be designated inactive again as soon as the election is over), but this is the general idea.
A large repository of ballots is therefore accumulated. Democrats being the type of people they are, I would not be in the least surprised to find that large numbers of phantom and inactive mail-in ballots don't even make it into the mail. This is supposition on my part, but given the number of extra ballots that they knew would be required in 2020, why post them and then find that they couldn't collect them because they'd gone missing, which the inactive ones may very well do if they're put through a letterbox? The biggest bang for their buck would be achieved if they got the USPS to stamp the envelope as received without it ever leaving the mail room.
In fact, why not get the ballots printed out of state (or, better yet, out of the country), perhaps utilizing the voter data collected by ERIC, and then truck them in? They could then be stored at Democratic Party offices until required. It may have gone something like it did in Fulton County, Georgia whose election officials ordered over a million “no-stub” absentee ballots from two companies in Arizona and Florida two to three weeks before the election.(51) “No stub”?
“The stubs number the ballots. When a ballot is used the manager keeps the stub to verify it was used. The ballot then becomes anonymous for the voter. With no stubs, there is no accountability of used/unused ballots.”(52)
The now notorious chief operating officer for the SoS, when questioned, claimed that they were a back-up in case the voting machines couldn't be properly tested before the election. This is not true as, firstly, the ballots were ordered after early voting in person (using the voting machines) had already commenced and, secondly, no envelopes were ordered, without which they couldn't be sent. Thirdly, the voting machines were never properly tested, anyway. These ballots were obviously never intended to go in the mail and there was, therefore, no valid reason for obtaining them.
Especially as the election officials would only have needed a little over a third of those ballots to service the total vote for the county. The SoS later claimed that none of these ballots had been used and that, in the interests of election transparency, Fulton County was destroying these back-up ballots. However, now there were only 284,901 of them; 773,309 had somehow gone missing.(53) I could take an educated guess as to where the rest of them went and who they voted for.
But how can all these different categories of ballots be most effectively fed into the system? Aren't postal ballots, for example, agnostic until opened? Mark Zuckerberg had some of the answers to those questions and the Democrat machine had the rest of them.
“First, a series of lawsuits by activist lawyers such as Mark Elias—and executive branch use of “emergency police powers” due to COVID-19—radically changed the management of the 2020 election, resulting in different treatment for different kinds of ballots and voters within several states. Absentee ballots and urban voters were favored, in-person voting and any jurisdiction that was not heavily Democratic were not.”(54)
Then Zuckerberg invested $419.5 million in the 2020 election. This included $350 million for the Center for Technology and Civic Life (CTCL), a cabal of Leftist election activists, who used it to infiltrate election offices at the city and county level with operatives who transformed the supposedly non-partisan offices into extensions of the Democratic Party.(55) As an aside, quite how private money was allowed to fund federal activity is mystifying, although it's a practice that is widespread in the US; think political campaigns funded by private industry and captured agencies such as the FDA, financed by those they are supposed to regulate. Now, elections can be added to the list.
Local election officials were now primed to put their thumb on the scale and babysit the entire process, a necessary precaution given the rampant corruption that was going to be needed to win the election. The cover for the operation was that it was simply a “get out the vote” campaign, nothing more shady than that, but the conditions that were created complemented the lawfare that overrode election law in the courts and enabled the practice of fraud. The pay-to-play scheme came with many strings attached in exchange for funds, including the now familiar requirement to promote universal mail-in ballots, the elimination or weakening of signature matching, the “curing” of wrongly cast ballots in favor of the Democrats and the installation of the infamous un-monitored drop boxes which would make a chain-of-custody trail impossible to verify.(56)

Figure 16
These boxes were predominantly installed in Democrat-heavy areas. They were deployed in concert with the practice of ballot harvesting (legal in 27 states and ignored by election officials in many more), whereby someone other than the voter is permitted to submit the ballot. The result? The controlled opposition in the conservative ranks is prepared to go as far as complain that Zuckerberg's intervention created a “two-tier election system favoring one demographic while disadvantaging another”,(57) – unfairly working hard to genuinely get out the Democrat vote, in other words - because they find themselves unable to acknowledge the true nature of the plan; if they did, their complicity would also be revealed. They have to stay in their lane and mind their p's and q's.
Which means that they have to ignore any evidence that doesn't fit the template, such as the revelation that, in Wisconsin and Pennsylvania (where ballot harvesting is illegal), 7% of the individuals that used the drop boxes submitted more than one ballot.(58) In Wisconsin alone, 107 people visited the drop boxes 2,000 times between them over the course of a fortnight.(59)
They also have to turn a blind eye to the fact that in Georgia (again) and other states, people stuffed piles of ballots in drop-boxes every night for weeks. They wore latex gloves and took pictures of every ballot. Some of them were dropping 50 to 100 at a time. These individuals were then tracked to Democrat offices and returned with yet more ballots.(60) Over 242 of these “mules” were identified, one of whom averred that he had been paid $45,000, or $10 a ballot for his overnight ballot stuffing enterprise, which was merely average. If his estimate is accurate, then this operation alone equates to about a million ballots in total,(61) in just one state, without taking account of any other fraudulent practices.
This in a state where ballot harvesting is illegal and yet nothing has come of these revelations. The SoS simply proclaimed that the election was sound and that was that.(62) It's almost like these people exist in a parallel universe, but they get away with their obfuscation because the mainstream media simply refuses to report the truth and most conservatives are either establishment Republicans – in which case they were gratified to be free of Trump – or sensitive souls who would not be able to withstand the trauma of being labelled a “denier”.
So, in practical terms, a bent election official would likely be pretty confident that a very high proportion of envelopes from drop boxes would contain ballots for Biden. The US Postal Service was also often a willing co-conspirator:
“An affidavit filed by a postal worker in Traverse City, Michigan states that various post offices illegally backdated ballots and ordered that Trump mail be placed in the “Undeliverable Bulk Business Mail” bin while demanding that Biden mail should be delivered promptly.”(63)
One might be forgiven for thinking that, with all of the advantages documented thusfar, the Democrats should have been on cruise control; taking out the hated Trump was surely a formality? However, that does not appear to be the case. They still needed further strings to their bow, so they also corrupted the election management system (EMS). A forensic analysis of voting machines came to the following conclusion:
“We conclude that the Dominion Voting System is intentionally and purposefully designed with inherent errors to create systemic fraud and influence election results. The system intentionally generates an enormously high number of ballot errors. The electronic ballots are then transferred for adjudication. The intentional errors lead to bulk adjudication of ballots with no oversight, no transparency, and no audit trail.”(64)
It also seems likely that one further weapon was deployed. Two students at the University of Michigan wrote some code that automatically and instantaneously swapped the filled in vote on a paper submitted ballot, like so.

Figure 17
The change takes place in about 40 milliseconds and before the ballot is saved on the EMS thus leaving no trace. The only way the fraud could be detected is via an audit that compared the paper ballots to the image on EMS, which wouldn't be an obvious check to make. This algorithm also keeps count of the “real” ballot results and can specify how many ballot images are changed, according to need. Elections can then be won by acceptable margins, rather than by suspicious blowouts. The software works on all the different scanners and ballots in use in American elections.
The designers even simulated an attack on an Oregon election and configured the software to only alter ballots that would not be detected by a human audit. Even within this limitation, they still managed to alter 34% of the votes. There is reason to believe that this software may not simply be confined to academia; a research engineer connected to the experiment worked for a Leftist company called Voting Works, whose mother company boasts donors such as Soros, Facebook and Google.(65) And, after all, why create the code and test it unless there is an intention to use it? As a final backup, when all else has proved insufficient, it has merit.
There is not doubt that there was a cornucopia of demonstrably fraudulent activity in the election which goes well beyond the infeasible anomalies already listed at the outset of this piece, all explicable by dint of the techniques I have alluded to. Post 'pandemic', multiple states mass distribute ballots (whether state rules allow it or not), including Arizona, Pennsylvania, Wisconsin, Michigan and others.(66) Realistically, one would expect the rejection rate to be a fair bit higher than usual, given the fact that many more people were voting remotely and were not therefore able to avail themselves of the assistance of poll station staff.
But this was not so in the battleground states; in 2016, the rejection rate in Pennsylvania was 1% - in 2020, it was 0.03%. The same ratio was applicable in Georgia and in Nevada, North Carolina and Michigan the rates were half, a third and a fifth respectively.(67) This can only mean that ballots were illegally “cured” (corrected) and, given the political orientation of the captured election offices, there is no reason to think that this would be a non-partisan, unbiased process.
In Georgia, some of the post-election evidence matched the supposition engendered by the back-up ballot BS. There were large numbers of uncreased ballots (at numerous counting locations) which had clearly never seen the inside of an envelope. Almost all of them were cast for Biden.(68) At least 96,000 ballots were apparently requested and then counted in the total, but weren't ever recorded as having been returned.(69) In addition, at least 168,000 illegal ballots are also known to have been cast.(70)
The number of unsupportable ballots in one county alone was forty-five times Biden's margin of victory in the entire state. There were no ballot images of 317,128 alleged in-person votes, a violation of state and federal law. There were no authentication files for 132,284 mail-in ballot images.(71) And, just to rub salt in the wound, around 200,000 votes had been electronically transferred from Trump to Biden at the precinct level.(72) Biden “won” by less than 12,000 votes.
In Michigan, election workers at in-person polling stations were told not to request photo ID.(73) Poll workers were also told to ignore signature mismatches.(74)(75)(76) Once again, unsecured, unsealed ballots numbering in the tens of thousands made an overnight appearance, arriving in vehicles with out-of-state licence plates.(77) Staff at counting stations were observed to be manually adding the names and addresses on these ballots to the voting file,(78) often with the birthdate of 1/1/1900,(79) thus confirming their lack of authenticity.
Republican poll challengers were routinely ejected, whereupon 'impartial' election officials would applaud and cheer.(80)(81)(82) Some ballots were backdated, others were run through the tabulation machines multiple times.(83)(84) It was a Leftist free-for-all, aided and abetted by the SoS's illegal implementation of a procedure that stipulated that all signatures on ballots would be presumed valid, regardless of their similarity to the sample on file.(85)
Wisconsin was just as bad. USPS backdated two tranches of 100,000 ballots that arrived the day after the election.(86) In addition, 49,000 voted for a Republican down ballot but apparently not for Trump,(87) 170,000 ballots that hadn't been applied for were submitted (88) and 88% of the eligible cohort allegedly voted.(89) There were also 157,000 duplicate voters and 120,000 who had been voting for over 100 years.(90) Biden “won” this state by 20,000 votes.
The official total in Nevada favored Biden by 33,000 votes. However, 42,284 people voted twice (or, quite possibly, someone ran their ballots through the tabulator twice over) and, amongst other instances of fraud, 20,000 votes were from individuals without a Nevada address and 30,000 listed addresses that weren't residential.(91)(92)(93) There were a minimum of 130,000 illegal ballots cast.(94)
And so it goes on. Pennsylvania's election practices would make a South American dictator blanch:
“Records show that in Pennsylvania, some 98,000 people voted only for Joe Biden and did not vote for anyone further down the ticket. The corresponding numbers in other key states were approximately: 80,000 to 90,000 in Georgia, 42,000 in Arizona, 63,000 in Wisconsin, and 69,000 to 115,000 in Michigan.”(95)
This was also the state where mail-in ballots time-traveled; as well as 51,000 apparently returned the day after they had been sent, 35,000 came back the same day and more than 23,000 had a return date that was earlier than the sent date.(96) A subcontractor for USPS testified that he had driven an entire truckload of ballots (perhaps as many as 288,000) from New York to Lancaster, Pennsylvania in late October, there being absolutely no valid reason for such a task.(97)(98)
Another tactic was also identified in Pennsylvania and then discovered in other swing states. Republican voters who had supposedly received mail-in ballots were surveyed – 1,706 of them. A third said that they'd never requested a ballot and, of the remaining 1,137, 42% said they'd mailed their ballots but were unaware that the state had neither listed them as received nor counted them. For context, 165,412 requested a ballot in Pennsylvania.(99)(100)(101) The respective numbers for Arizona, Georgia, Michigan and Wisconsin are 50%, 44%, 33% and 20%.(102)(103)(104)
All in all, the 2020 US election was about as insecure as it could be. It's possible that the only people who really know how big the conservative majority is are the fraudsters themselves, but limited canvasses of voters (kryptonite to elections fraudsters) reveal an irregularity rate of around 20%.(105) Despite everything they had already thrown at Trump and in spite of the scale of the cheating involved in the actual election (including the near-certainty that thousands upon thousands of votes were deleted from his total), he still gained 11 million extra votes over 2016. While the machinery of The Big Steal was Democrat controlled, they were assisted by co-conspirators:
“It wasn’t the Democrats who stole the election in 2020. It was the politicians. The Democrats couldn’t have gotten away with it without the Republicans handing it to them and looking the other way.”(106)
The Uniparty will always double down. They have no respect for anyone who opposes them, they have no respect for the law or due process and there is nothing and nobody to hold them accountable. Their hatred of Trump was (and is) visceral and they were prepared to do whatever it took to get him out of the White House. To them, he was a clear and present danger and he needed to be taken out.
Republican complicity can be inferred from the fact that the vast scope of the fraud from the 2020 election has never been addressed; in fact, they can't even bring themselves to question a single element of it, which means that they are prepared do it all over again, if required.
The result itself was pre-ordained and the malfeasance would not have been particularly visible were it not for Trump's performance in Florida and Texas. If the Big Pause hadn't been necessary, there would have been no questions asked. All the incomprehensible voting patterns in the red counties and the rapidly escalating “divide” between the rural and the urban voter would never have been the subject of speculation; the narrative would have held and only the fringe would have dared to question it.
But, priority number one was to stop Trump and they were prepared to torch the illusion of electoral propriety in order to do so. Now, what's has been revealed cannot be unseen and over 60% of Americans have at least some idea of what happened. The genie is out of the bottle and won't be going back in anytime soon. The ruling class don't care, because they got what they wanted and they'll do it again if they have to.
Citations
(1) https://www.westernjournal.com/gen-flynn-exclusive-10-indisputable-facts-2020-election-argue-audits/
(2) https://www.statista.com/statistics/1139251/voter-turnout-in-us-presidential-and-midterm-elections/
(3) https://electionfraud20.org/trend-analysis/3-historical-county-trends/
(4) https://electionfraud20.org/trend-analysis/most-populated-counties/
(5) https://electionfraud20.org/trend-analysis/dvi-trend-anomalies/
(6) Ditto
(7) https://electionfraud20.org/in-detail/battle-for-largest-counties/
(8) https://www.americanthinker.com/articles/2022/11/nospot_dice_and_modern_elections.html
(9) https://electionfraud20.org/trend-analysis/zdvi-trend-anomalies/
(10) https://electionfraud20.org/trend-analysis/unlikely-z-scores/
(11) https://electionfraud20.org/trend-analysis/rvt-trend-anomalies/
(12) https://electionfraud20.org/trend-analysis/historical-voting-rate-trends/
(13) https://electionfraud20.org/trend-analysis/3-historical-county-trends/
(14) https://electionfraud20.org/in-detail/bellwether-states-counties-2020/
(15) https://www.politico.com/2020-election/results/washington/
(16) https://electionfraud20.org/in-detail/bellwether-states-counties-2020/
(17) https://electionfraud20.org/trend-analysis/most-populated-counties/
(18) https://electionfraud20.org/trend-analysis/most-populated-counties/
(19) https://www.politico.com/news/2020/04/08/bernie-sanders-suspends-his-presidential-campaign-175137
(20)
(21) https://en.wikipedia.org/wiki/2020_United_States_presidential_election_in_Ohio#Final_predictions
(22) https://en.wikipedia.org/wiki/2020_United_States_presidential_election_in_Florida#Final_predictions
(23) https://en.wikipedia.org/wiki/2020_United_States_presidential_election#Results
(26) https://www.frontpagemag.com/yes-it-was-stolen-election-john-perazzo/#_edn45
(28) https://www.cisa.gov/news-events/ics-advisories/icsa-22-154-01
(29)
(31) https://spectator.org/early-vote-malignancy-metastasized-in-midterm-elections/
(33) https://www.nationalreview.com/2020/03/early-voting-encourages-voting-on-limited-information/
(34) https://electproject.github.io/Early-Vote-2020G/Early_Vote_Analysis_11_01.html
(37) https://web.archive.org/web/20220716054414/
(38) https://elections.wi.gov/node/7220
(41) https://legis.wisconsin.gov/lab/media/3288/21-19full.pdf
(42) https://www.americanthinker.com/articles/2022/02/we_need_a_sarbanesoxley_law_for_voter_rolls.html
(43) Ditto
(44) https://web.archive.org/web/20220407040034/
(45) http://wiseenergy.org/Energy/Election/State_Select_2016-2020_Election_Data.htm
(46) https://web.archive.org/web/20220407040034/
(47) http://wiseenergy.org/Energy/Election/State_Select_2016-2020_Election_Data.htm
(50) Ditto
(53)
(54) https://www.uncoverdc.com/2021/11/12/fulton-county-and-sos-plan-to-destroy-unused-ballots/
(57) Ditto
(64) https://www.frontpagemag.com/yes-it-was-stolen-election-john-perazzo/#_edn88
(66) https://www.frontpagemag.com/yes-it-was-stolen-election-john-perazzo/#_edn88
(69) https://www.americanthinker.com/articles/2023/02/why_the_2020_election_was_unverifiable.html
(70) https://www.frontpagemag.com/yes-it-was-stolen-election-john-perazzo/#_edn88
(74) https://greatlakesjc.org/wp-content/uploads/Complaint-Costantino-FINAL-With-Exhibits.pdf?x44644
(77) Ditto
(78) https://www.courtlistener.com/docket/18619867/1/2/donald-j-trump-for-president-inc-v-jocelyn-benson/
(80) https://www.courtlistener.com/docket/18619867/1/donald-j-trump-for-president-inc-v-jocelyn-benson/
(83) https://www.courtlistener.com/docket/18619867/1/2/donald-j-trump-for-president-inc-v-jocelyn-benson/
(84) https://www.americanthinker.com/articles/2023/02/why_the_2020_election_was_unverifiable.html
(86) https://twitter.com/justin_hart/status/1324461534601383936
(91) https://www.foxnews.com/politics/trump-lawyers-claim-40000-double-votes-in-latest-nevada-lawsuit
(95) https://www.frontpagemag.com/yes-it-was-stolen-election-john-perazzo/#_edn88
(96) https://www.theepochtimes.com/pennsylvania-100000-ballots-with-implausible-return-dates_3572942.html
(100) https://twitter.com/MattBraynard/status/1328539681965871104
(101) https://twitter.com/MattBraynard/status/1329449463354695682
(103) https://www.courtlistener.com/docket/18632787/6/4/wood-v-raffensperger/
(104) https://twitter.com/MattBraynard/status/1329449463354695682
(106) https://amgreatness.com/2022/11/13/this-wasnt-an-election/
Figure 1 https://electionfraud20.org/trend-analysis/3-historical-county-trends/
Figure 2 https://electionfraud20.org/in-detail/battle-for-largest-counties/
Figure 3 Ditto
Figure 4 Ditto
Figure 5 https://electionfraud20.org/in-detail/battle-for-largest-counties/
Figure 6
Figure 9
Figure 10 Ditto
Figure 13 Ditto
Figure 14 Ditto
Figure 15 Ditto
Figure 17