

Getting Colder

In mid-January, oil and gas producers in North Dakota were forced to take 650,000-700,000 barrels of output offline (out of a total of around 1.2 million barrels a day on average). The reason? It was very cold.

Figure 1
It was the same in the Rockies.

Figure 2
In Alaska, it's been -30°F at night and Anchorage has, for the second year running, had over 100 inches of snow so far this season, with power to add. The last time that happened was in the winters of 1954-55 and 1955-56.(1) Roofs on commercial buildings, built with Alaskan winters in mind, are collapsing due to the weight of the snow. The American Northeast has been taking incoming for weeks.

Figure 3
Even football games, infamous for playing in all weathers, have been cancelled.

Figure 4
There is much talk of polar vortexes, not for the first time this winter – October/November was the same.
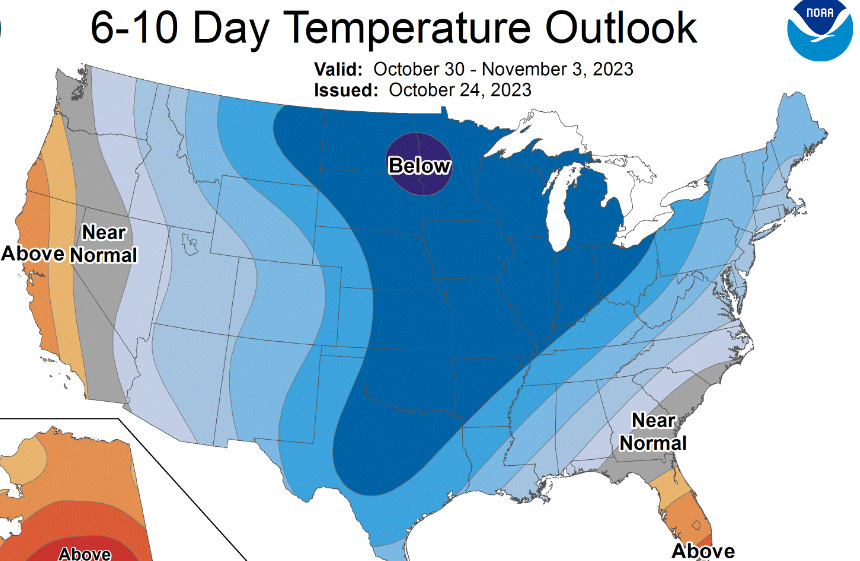
Figure 5
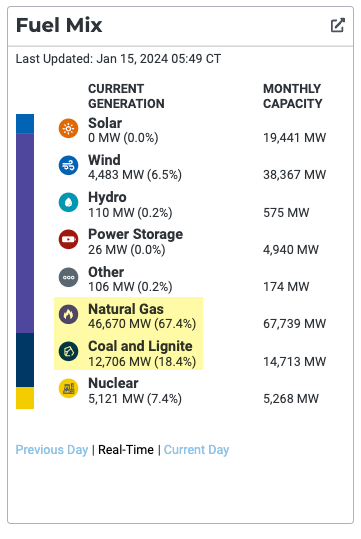
The greenish Texas power grid, one of the eco-warriors' standout achievements, was burning as much gas and coal as they could get their hands on (how dare they?)

Figure 6
Tesla super-charging stations became EV graveyards in the extreme cold, when cars refused to charge up.

Figure 7
Of course, one bad winter in America doesn't necessarily tell us much of anything. However, it isn't just the US that's setting records. In December, Beijing has its coldest day in 70 years. Even India has recently had days so cold that they broke 80 year old records.(2) On January 8th, “Arctic sea ice stood at its highest level in 21 years.”(3) The lowest recent levels were recorded in the 1950s-1970s.(4) Even Antarctica, a consistent favorite of the climatistas, isn't really playing ball.

Figure 8
The Antarctic continent itself hasn't, in fact, warmed for the last 70 years.(5) Even those charged with the task of stoking alarmism - “It’s so far outside anything we’re seen, it’s almost mind-blowing” -(6) are undone by comments they made in the less shrill recent past:
“Even in the passive microwave record [available since 1979] for the Antarctic you see these seesaws where the ice concentrations go up and down, so extreme high or extreme low are not that unusual.”(7)
Yet, according to the words of our unerring guides from the Fourth Estate (just prior to the polar vortex), 2023 was the hottest year on record.

Figure 9
This claim is, as is usual, baloney:
“A deep dive into figures published by the U.S. National Oceanic and Atmospheric Administration (NOAA) reveals that the ‘hottest ever’ claims did not apply to large areas of the world including Asia, Europe, North America, Oceania, East N. Pacific, Hawaiian region, Arctic and Antarctic. Investigative science writer Larry Hamlin notes in the science blog Watts Up With That? that at least 58% of the Earth’s land surface where 73% of the world's population lives did not experience the hyped ‘highest ever recorded’ average temperature anomaly.”(8)
For starters, 2023 was an El Niño year; such years are always warmer than the years either side. Secondly, the collection of surface temperature data has been hopelessly corrupted for decades. 96% of the US weather stations that are relied upon by officialdom are not fit for purpose, as they are invalidated by the urban heat island effect,(9) which has been found to be responsible for 57% of all alleged warming since 1895.(10) Figure 10, which shows a digital measuring device positioned next to “a large building complete with five air conditioning units pumping out hot air”, is not atypical.(11)

Figure 10
A more accurate recent record, taken from 114 carefully sited measurements stations, looks like this.

Figure 11
The UK's Met Office can be listed as a co-conspirator:
“Since 2013, the Met Office has boosted recent global warming by 30%, depressed past measurements and abolished the temperature pause from 1998 to 2012 – this pause is still discernible in the accurate satellite and meteorological balloon record.”(12)
Despite these attempts to finagle the heat record higher, the alleged average UK temperature in July 2023 was 16.6°C, just 0.1°C above that of July 1976, the year of a famous, prolonged heatwave. Given that the population of the UK is now 11 million higher and the level of urbanization is greater, it would not be unreasonable to surmise that temperatures are actually falling.
The University of Alabama in Huntsville (UAH) has compiled a satellite record. This shows a slight warming trend since 1979; it also shows a temperature pause between 1998 and 2012 and another one that had lasted eight years by March 2022.
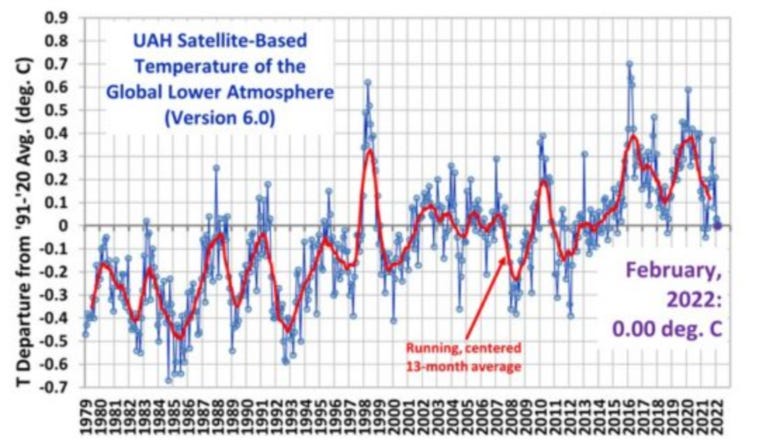
Figure 12
If we are to believe the catastrophists, we must remember the unbreakable link between atmospheric CO2 and rising temperatures. Presumably, given that global temperature is static (or very close to static, at worst), there must have been a commensurate leveling off of CO2 emissions. Well, not according to the 'experts' ' estimates, no. There's a temporary fall, due to the 'pandemic', but otherwise the trend is relentlessly upward; which is somewhat peculiar. Atmospheric CO2 is said to have risen from 275 ppm (parts per million) prior to the Industrial Revolution to over 400 ppm today.(13)

Figure 13
Yet temperatures in the Roman Warming, which lasted 800 years until around 600AD, were warmer than today by between 2°C and 6°C.(14) The Vikings established vineyards on Greenland; this was possible because the poles tend to see more temperature variability and it's likely that Greenland was up to 4°C warmer than today. The Vikings even called Newfoundland 'Vinland'.(15) We also know that German vineyards operated at heights of 2,500 feet above sea level, 1,000 feet higher than now, and the English were growing grapes as far north as Hadrian's Wall.(16) This period is not noted for its heavy industry and coal fired power stations.
Global temperature declined between 1945 and 1975, the exact time frame associated with an increase in atmospheric CO2. Although today's Green lobby is keen to memory-hole the early seventies, their alarmist predecessors were all-in on global cooling, not global warming;
“The world is cooling and global temperatures could drop by up to 11ºC that would freeze the North Atlantic for 4- months of the year within 20-years …”(17)
So, how can this be, if atmospheric CO2 is the primary driver of increasing global temperature? How is it that the record temperatures for cities all across the US are decades old?
“...for New York City, the highest temperature ever recorded was 106 on July 9, 1936. St. Louis recorded its record high on July 14, 1954. The highest ever for Dallas was 115 on August 18, 1909. For Los Angeles, 110 on Sept. 26, 1963.”(18)
In fact,
“...none of the record highs in the 50 states occurred after 1995, but two all-time record lows occurred in the 2000s: one for Maine in 2007 and Oklahoma for 2009. No record highs during the last 29 years, yet we’re going to be baked like a mackerel?”(19)
The answer is that, if there is a relationship between atmospheric CO2 and temperature, it's mostly the other way round; temperature first, then a rise in atmospheric CO2. The lag time is usually around 800 years, give or take and is probably mostly to do with the release of carbon dioxide from the oceans, the greatest repository of readily accessible CO2. Sea water absorbs more carbon dioxide when it is cold and releases it when it warms.
CO2 in the atmosphere slows down heat loss, but it doesn't wholly prevent it. If there was none, far more heat would be lost and the Earth's average temperature would be -3°C , not 15°C as it is now. But the efficiency of the heat trap is insensitive – if atmospheric CO2 was doubled, it would make very little difference to global temperature; perhaps an increase of 0.3°C . That's all.(20)
“Carbon dioxide in the atmosphere operates like a curtain on a window. If you want to keep out light, add a curtain. A second curtain makes little difference.....CO2 operates the same way. Once there is about 400 ppmv CO2 in the atmosphere, the doubling or tripling of the CO2 content has little effect on atmospheric temperature because CO2 has adsorbed all the infra-red energy it can adsorb.”(21)
That is not to say that there isn't more atmospheric CO2 – just that it isn't warming the planet. What it is doing is accelerating global plant growth, or 'global greening' as it is known. Some estimates suggest that levels have increased by 14% since 1980,(22) and the effect is measurable over between 25%-50% “of the global vegetated area.”(23)

Figure 14
Since 1982, despite the alleged destruction of large swathes of the Amazon rainforest, Earth's tree cover has increased by 2.24 million square kilometers (or 7.1%).(24) Additionally;
“...higher CO2 has contributed to an estimated annual 2.4-3.8% rise in maize, rice, soyabean and wheat – four staples that provide 64% of human caloric intake.”(25)
If we were lucky enough to find that Mother Nature reprises the Roman Warming, life would be even better. But that isn't going to happen, as what we have been told is, literally, the polar opposite of what's in store. Not only that, but the near certainty of a grand solar minimum has been predicted for well over a decade. Back in 2012, before the Daily Mail editorial staff had drunk deeply from the wokeists KoolAid, they were sometimes inclined towards truth-telling. While discussing the eleven year solar cycles (at that time, Cycle 24 was peaking), the paper revealed that;
“...there is a 92% chance that both Cycle 25 and those taking place in the following decades will be as weak as, or weaker than, the 'Dalton minimum' of 1790 to 1830. In this period...average temperatures in parts of Europe fell by 2C.
However, it is also possible that the new solar enemy slump could be as deep as the 'Maunder minimum'..., between 1645 and 1715 in the coldest part of the 'Little Ice Age' when, as well as the Thames frost fairs, the canals of Holland froze solid.”(26)
This is not a fanciful prediction. Even NASA, notorious cheerleaders for the climate zealots', have been obliged to acknowledge a cooling trend.(27) We are currently just over four years into Cycle 25 and sun spot activity, the most impactful influence on the earth's climate, had been expected to fall from a high of over 100 in 2014 to a low of zero in 2022. Instead, the Sun moved up the timeline and by mid 2018, the count was zero and has been much lower than forecast ever since.(28) Cycle 24's solar maximum was the weakest in a century.(29) And those polar vortexes? They typically spin near the North Pole, not Chicago.(30)
So, instead of 'runaway global warming' we will, instead, find ourselves dealing with a solar minimum. The question is; will it be a Dalton or a Maunder, aka grand solar minimum (GSM)? Well, GSM's come around every 350-400 years and the last one started 380 years ago, so the odds are against us. It seems that the minimum between cycles 25 and 26 – the former will end in late 2030 – will likely be the coolest period. Cloud cover will increase and the years 2028-2032 are shaping up to be dark and cold.(31) The good news doesn't end there, though:
“Historically, GSMs have been associated with extreme weather events. Floods, droughts, heavy snowfall, late springs, and early autumns have all resulted in famine. Famine during GSMs has led to starvation and societal upheaval.”(32)
So, ask yourself this; if our governments know that we are already in a cooling cycle that will get progressively colder (and, if NASA knows, they know), why are they doing their darnedest to de-industrialize, ban fossil fuels and sabotage the food supply? It couldn't be for the same reason they tried to jab us all, could it?
“...we just don’t need the vast majority of the population. Because the future is about developing more and more sophisticated technology, like artificial intelligence [and] bio-engineering. Most people don’t contribute anything to that, except perhaps for their data, and whatever people are still doing which is useful, these technologies increasingly will make redundant...”(33)
Citations
(1) https://redstate.com/wardclark/2024/01/30/anchorage-sees-pandemic-of-snow-n2169427
(3) https://dailysceptic.org/2024/01/16/arctic-sea-ice-extent-soars-to-highest-level-for-21-years/
(4) Ditto
(5) https://www.nature.com/articles/s41612-020-00143-w
(6) https://dailysceptic.org/2024/01/16/arctic-sea-ice-extent-soars-to-highest-level-for-21-years/
(7) https://www.earthdata.nasa.gov/learn/articles/new-data-from-old-satellites-a-nimbus-success-story
(8) https://wattsupwiththat.com/2024/01/16/2023-earths-hottest-year-on-record-claims-fail/
(12) Ditto
(13) https://www.theworldcounts.com/challenges/climate-change/global-warming/global-co2-emissions
(14) Ian Plimer, Heaven And Earth, Global Warming: The Missing Science, pg 59.
(15) S. Fred Singer and Dennis T. Avery, Unstoppable Global Warming Every 1,500 Years, pg 47.
(16) Brian Sussman, Climategate, pg 28.
(17) https://climatechangedispatch.com/120-years-of-climate-scares-1970s-ice-age-scare/
(19) Ditto
(20) Ian Plimer, Heaven And Earth, Global Warming: The Missing Science,pg 366.
(21) Heaven And Earth, pg 374.
(23) Ditto
(24) https://www.nature.com/articles/s41586-018-0411-9
(29) https://phys.org/news/2014-07-suddenly-sun-eerily-quiet-sunspots.html
(32) https://www.americanthinker.com/articles/2021/04/the_coming_modern_grand_solar_minimum.html
Yuval Noah Harari https://www.fulcrum7.com/news/2022/8/18/wef-we-dont-need-the-vast-majority-of-the-population 33
Figure 1 https://www.zerohedge.com/commodities/cold-blast-takes-half-north-dakotas-oil-production-offline
Figure 2 Ditto
Figure 3 https://twitter.com/RyanMaue/status/1745071347363987581
Figure 4 https://twitter.com/ActionNetworkHQ/status/1746216769465757719
Figure 5 https://twitter.com/zerohedge/status/1717220954743480502
Figure 6 https://cms.zerohedge.com/s3/files/inline-images/2024-01-15_06-54-11.png?itok=0IeOZGdP
Figure 7 https://www.aol.com/news/tesla-supercharging-station-packed-oak-233049495.html
Figure 8 https://dailysceptic.org/2024/01/16/arctic-sea-ice-extent-soars-to-highest-level-for-21-years/
Figure 9 https://www.zerohedge.com/weather/why-are-hottest-year-ever-headlines-spiking-right-polar-vortex
Figure 13 https://grist.org/climate/was-2020-the-year-we-reached-peak-carbon-emissions/